Service Mix Ratios That Support $5M Remodeling Revenue
Mixing anchor projects with faster-turn work keeps crews busy and protects against project delays.

How the top-performing segment of the remodeling industry structures its revenue
Hitting $5M in remodeling revenue is a different problem than hitting $1M, and treating it like the same problem is the mistake that stalls contractors in the middle of seven figures. At $1M, more bids and more leads fix most things. Past that point, the mix of project types affects growth more than the lead count does, and contractors who keep pulling the same lever (more bids, more crews, same playbook) hit a wall for reasons that have nothing to do with effort.
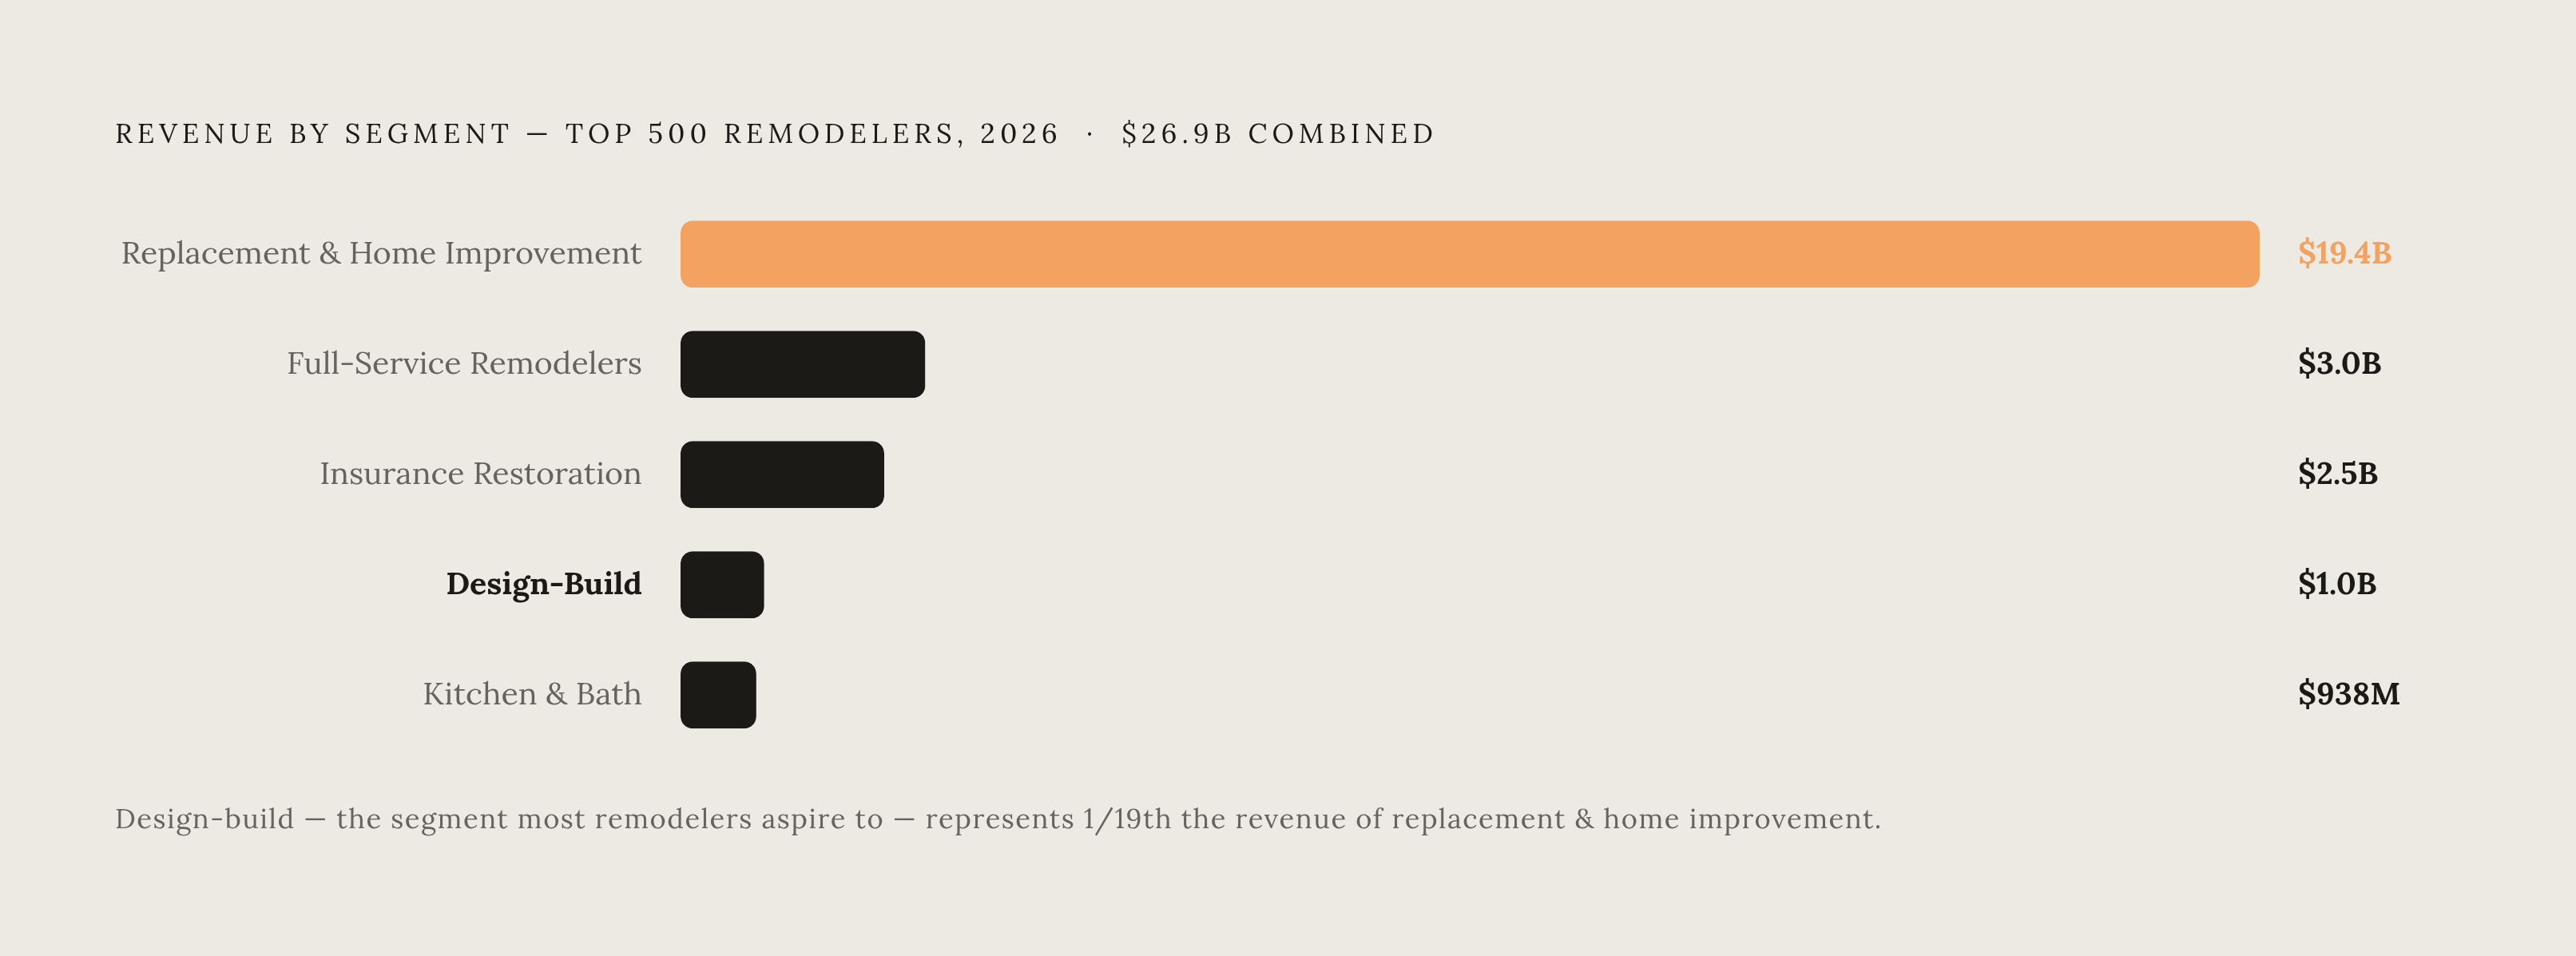
The 2026 Top 500 remodeling companies, tracked by Qualified Remodeler, pulled in a combined $26.9 billion in remodeling revenue. Replacement and home improvement work made up $19.4 billion of that, close to 72% of the whole pie. Full-service remodelers brought in around $3 billion. Insurance restoration came in at $2.5 billion. Design-build, the category most contractors picture when they imagine "making it" in this business, landed just over $1 billion. Kitchen and bath specialists brought in $938.5 million.
Anyone chasing design-build as the finish line is chasing the smallest number on the list. The industry's real weight is in replacement and home improvement: faster jobs, tighter scopes, quicker turnaround. That doesn't make design-build worthless: it means the businesses doing the most volume aren't the ones running full custom kitchens all day, and copying the wrong role model costs years. It means the businesses doing the most volume aren't the ones running full custom kitchens all day, and copying the wrong role model costs years.
None of this means a small contractor should copy the Top 500's exact ratios. Those firms run marketing budgets and staffing layers a $1M or $2M shop doesn't have yet. The logic still holds at any size, though: a blend beats a single-lane strategy, whether the business is doing $1M a year or many times that.
Anchor projects: what high-ticket work contributes to a $5M mix
Anchor projects are the big scopes: kitchens, baths, additions, whole-house remodels. A handful of these jobs can carry a disproportionate share of annual revenue. That's why so many contractors build their whole identity around them, and why leaning on them alone is a bad bet.
Look at the kitchen and bath numbers from the 2026 Top 500. Thirty-two companies reported $938.5 million in combined revenue across 53,017 completed jobs, with 2026 projected to hit roughly $1 billion, a 7.1% jump. The number underneath that headline is more important: average revenue per job across 31 comparable firms rose only slightly, from about $17,442 to $17,656. Volume didn't drive that growth. Twenty-three of those 31 firms raised their own average job price, with the median company posting a 6.4% increase. The growth came from charging more per job, not doing more of them.
Booher Remodeling Co., out of Indianapolis, makes the point in one case. The company grew remodeling revenue 25% to $10.5 million while completing 140 projects in both years, so every bit of that growth came from ticket size, not job count. Average revenue per job climbed from around $60,000 to $75,000, driven by pushing into room additions, finished basements, and older-home remodeling, plus a wider service area.
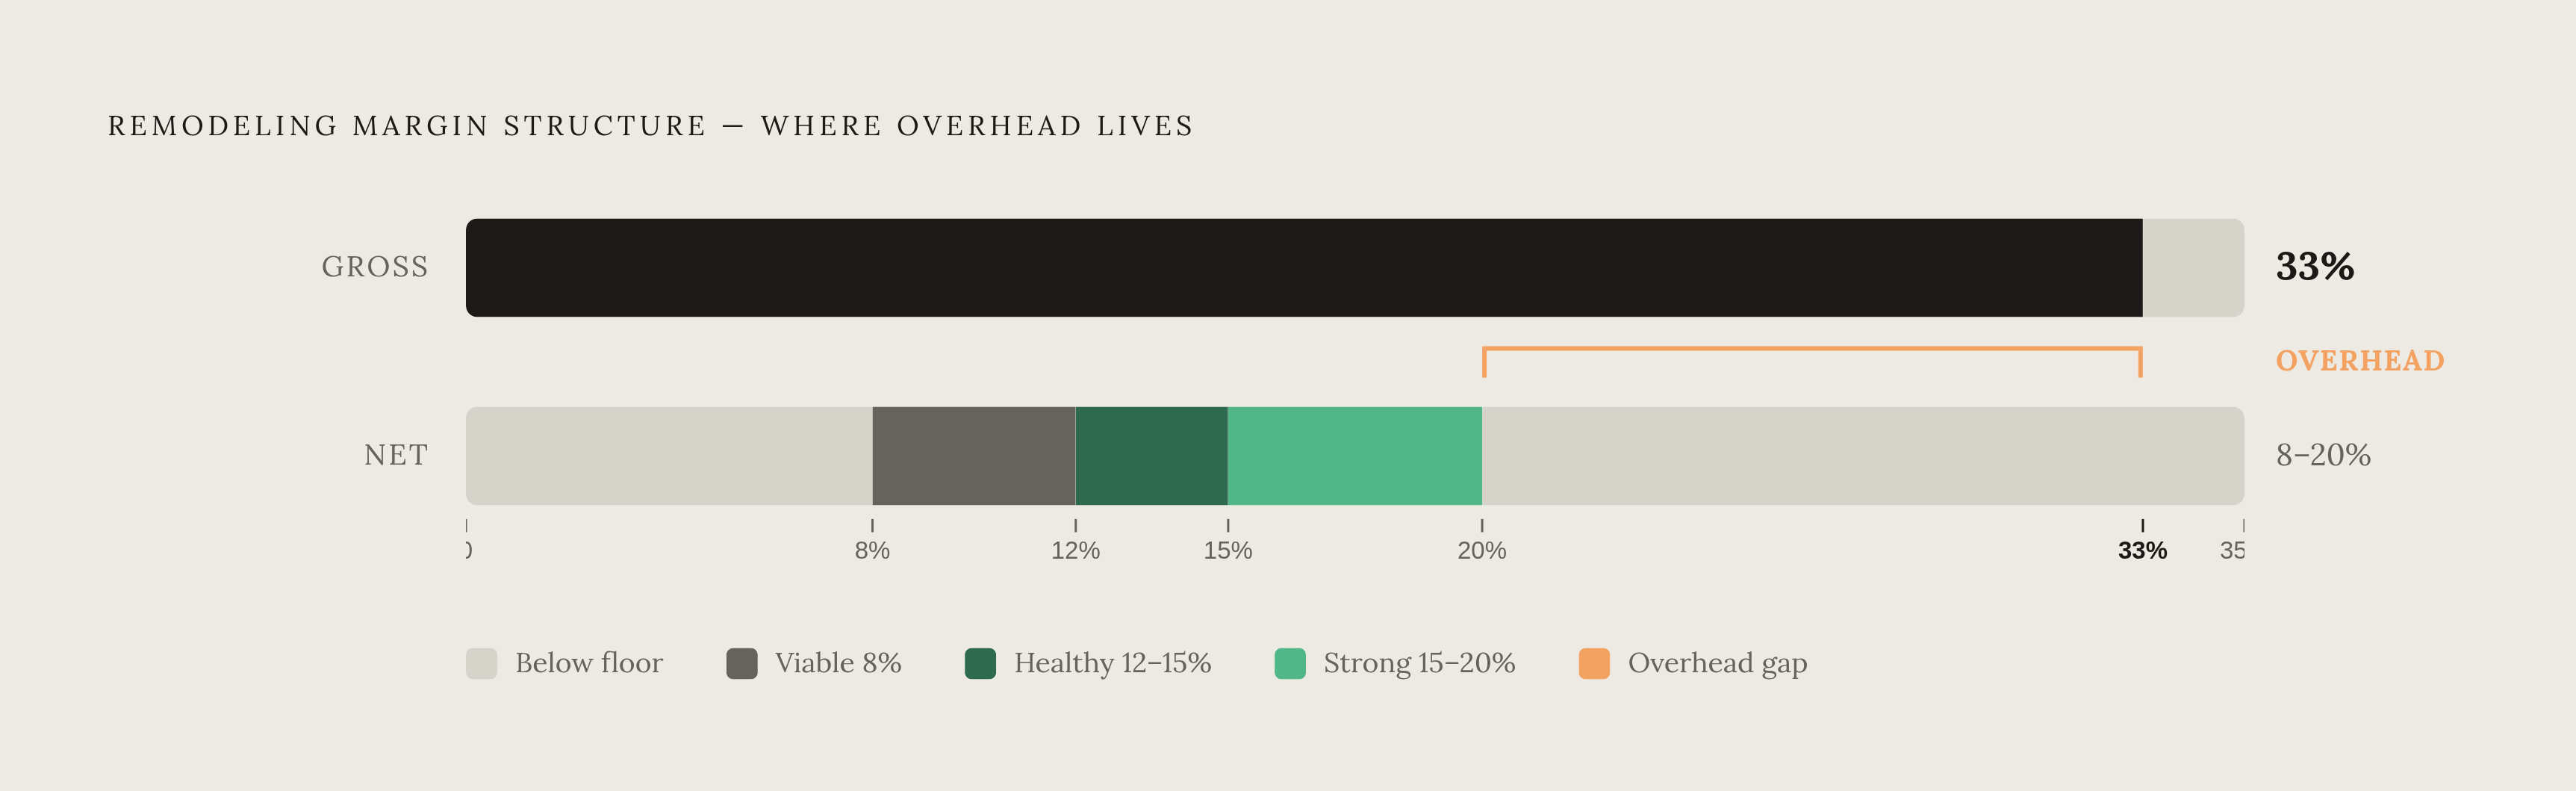
Projul's construction margins guide puts net margins on this kind of work in a range from 8% at the viability floor up to 15% for healthy performers. Hitting the top of that range takes self-performing trades and job costing tight enough to catch cost drift before it eats the job alive.
Anchor projects run on long sales cycles too, averaging around 60 days from first contact to close according to WebFX's benchmarks. That means the pipeline has to get built months ahead, not filled reactively once the calendar looks thin. And if anchors make up most of a contractor's revenue, two or three going sideways in the same quarter wrecks cash flow for the whole year. Design-build firms, which lean hardest into this model, pulled in just over $1 billion of the Top 500's $26.9 billion, and that thin slice reflects exactly this concentration risk. Five $500,000 projects a year sounds like a strong book of business, until one gets delayed, one goes over budget, and the third client stops answering calls. There's no cushion left once that happens.
Volume work: the faster-turn layer that keeps crews and cash moving
Volume work covers bath replacements, cabinet refacing, flooring, window and door replacement, siding. These are the scopes that close fast, staff fast, and invoice fast. The whole point of this layer is solving a problem anchor projects create on their own: idle crews with nothing billable to do between mobilization, inspection holds, and design revisions.
The conversion numbers back this up directly. WebFX's benchmarks show outdoor services, plumbing, and similar faster-turn trades converting leads at 12% to 16%, while remodeling overall converts at just 3% to 7%. Faster-turn scopes inside a remodeling business behave like that higher-converting category: quicker close, less back-and-forth to get a signature.
Even inside the premium kitchen and bath segment, the market is drifting toward smaller, faster jobs. Baths grew to 63.3% of the average company's work in the Qualified Remodeler data, up from 61.7% the year before, while kitchens dropped from 29.8% to 25.9%. That shift is happening inside a segment built around high-ticket work, which says something about where the real growth is coming from.
Kurtis Kitchen & Bath, based in Michigan, grew revenue 34.2% to $19.4 million while completing 621 jobs, up 11.5% from the prior year, and held average job value above $31,000 the entire time. The instinct at that revenue level is to assume bigger tickets did the work. Here, it was volume: new markets, more jobs closed, same price discipline.
The $19.4 billion replacement and home improvement segment at the top of the Top 500 chart is the clearest signal in the entire dataset. Scaled remodeling revenue leans on fast-turn work far more than the industry's self-image admits. Any contractor building toward $5M who treats volume work as a filler category rather than a real layer is leaving crew hours unpaid.
Recurring revenue: the third layer most remodelers skip
Recurring revenue for a remodeling contractor means annual maintenance plans, seasonal service programs, warranty tiers, or commercial maintenance agreements, and it bills on a schedule whether or not a new project closes that month. Most remodelers skip this layer. That's a mistake, not a neutral choice, and it's the single most avoidable gap in this whole structure.
The logic is straightforward: a service company running hundreds of active maintenance contracts knows its revenue floor before the season even starts. That predictability changes how a company hires, forecasts, and takes on risk, and the same logic applies to a remodeling contractor carrying even a small maintenance base.
The gap between doing this well and doing it badly is wide. Research into maintenance contract programs finds recurring attach rates of 25% to 40% for companies with structured pitching processes, compared to 10% to 15% for those without them. That's two to three times the attach rate, and the difference comes down to how systematically the offer gets made.
The commercial side shows the same pattern at scale. FieldProxy's commercial service industry report finds the commercial managed services segment growing 18% annually as building owners shift from break-fix repairs to predictive maintenance. Retention is where AI-powered commercial service companies pull ahead: FieldProxy's data shows them holding 94% contract retention, versus 76% for traditional providers. That 18-point gap separates recurring revenue that functions as a real moat from recurring revenue that quietly churns away while looking fine on paper.
Skipping this layer feels reasonable in the moment. It looks like a distraction from the "real" project work, it needs a sales motion nobody trained a remodeler to run, and it doesn't fit the mental model most contractors built their business around. But at $5M, even a small recurring base, enough to cover a month or two of fixed overhead, changes what a contractor can afford to risk on hiring and growth. It doesn't need to be large. It needs to exist, and most books at this stage have none.
Blended margins hide problems that kill growth at the worst moment
A company reporting 12% overall gross margin looks fine on paper, and that's exactly the trap. If one service line runs at 19% and another limps along at 6%, the blended number buries the real problem. A contractor climbing toward $5M on that mix is using strong lines to prop up weak ones without ever seeing it happen, until the weak line grows big enough to drag the average down.
Gross and net margin tell different stories, and the gap between them is where overhead lives. WebFX's benchmarks put industry-wide gross margins across home services at an average of 33%. Projul's guide breaks net margin for remodeling into three bands: 8% as the floor for viability, 12% to 15% as a healthy range, 15% to 20% as genuinely strong. Overhead doesn't shrink neatly as revenue grows, so that gap needs constant attention throughout the year, not just a once-a-year glance at the P&L.
The fix is tracking margin by service line, kitchens against baths against additions against volume replacement, run as separate mini-P&Ls instead of folded into one number. That's the only way to see which lines earn their keep and which ones get carried by the rest of the business. If kitchens consistently net 15% and something else nets 4%, the rational move is to do more kitchens and either raise prices on the weak line or refer that work out. That decision stays invisible without the breakdown, and so many contractors never make it.
Lead costs sneak past most job costing systems too. Kitchen and bath companies in the 2026 Top 500 spent an average 9.2% of remodeling revenue on marketing, above the Top 500 overall average. Qualified Remodeler reports a median cost per issued lead of $400, with 14 of 31 companies reporting costs of at least $500, and two companies over $1,000. Those costs belong inside each service line's real margin, not sitting off to the side as a marketing line item nobody ties back to the job.
Leakage between quoting and getting paid costs more than most owners assume. Closing the gaps in that process can meaningfully lift net profit, making price realization one of the cleanest, most direct profit levers in a service business. Companies running one unified system for estimating, job costing, and invoicing, instead of three disconnected tools, make 36% more money per employee than companies working off fragmented systems. Disconnected tools aren't a minor inconvenience. They cost real margin, quietly, every single month.
What the ratio looks like across growth stages from $1M to $5M
The mix that works at $1M isn't the mix that gets a contractor to $3M, and the mix at $3M isn't the mix that gets to $5M. Each stage runs into a different bottleneck, and the portfolio has to shift to solve it.
Somewhere around $1M to $2M, anchor projects dominate because the owner is still closing and running the jobs personally. Volume work happens opportunistically rather than by design. Recurring revenue is usually absent, or exists informally as a handshake with a handful of past clients. The bottleneck here has nothing to do with the market and everything to do with the owner's own hours in the day.
Between $2M and $3M, that bottleneck gets worse before it gets better. The owner is still the whole system at this stage, still holding dispatching, estimating, and lead generation in one head. Anchors eat up all the available management attention, volume work gets ignored or handed off badly, and recurring revenue never gets built because nobody has time to build it. The fix here is systematizing the volume layer first. It's far easier to standardize and delegate than anchor project management, which still leans on judgment calls the owner hasn't figured out how to teach yet.
Getting to $5M takes a real leadership team, an investment in management capacity, not just more crew hours stacked on top of the same owner-run system. By this stage the three-layer structure is explicit: anchors carry the revenue concentration, volume work keeps crews utilized and cash moving, recurring revenue sets a floor under both. The KPIs that predict growth here are job close rate, average ticket value, technician utilization rate, and recurring revenue as a share of total revenue. Staffing works best as a decision made ahead of need, not after: A practical rule: if crews are booked more than four days out, that's the signal to hire, not the next signed anchor project.
Frontier Air Conditioning offers a reference point outside remodeling proper but inside the same growth logic. Jay V. took the company from under $1M to a forecast of $6M by building out a team rather than personally closing every job himself. That's the same shift a remodeling contractor has to make on the way to $5M: stop being the system, and build the mix of anchors, volume, and recurring revenue that runs without the owner standing in the middle of every job.