KPI Dashboards Used by Large Remodeling Franchises
Franchise operators organize dashboards by audience, not by metrics.

Franchise operators pick an audience before they pick a metric. That's the part most independents get backwards: they grab a KPI list off a franchise disclosure document and slap it onto one screen, without asking who's supposed to read it. Three dashboard types answer three different questions, and mixing them together is how a dashboard turns into wallpaper nobody looks at twice.
A strategic dashboard goes to ownership. It's the glance-once-a-week check for whether the business is fundamentally okay. An operational dashboard serves the people running jobs day to day, built to catch a bottleneck before it turns into a missed deadline. A financial dashboard asks a sharper question than whether the crews are busy: is the work coming in actually making money, or just keeping trucks moving while margin leaks out the back door.
Somewhere between 7 and 12 KPIs per dashboard is the number that actually gets read. Past that, a dashboard turns into a spreadsheet dump nobody has time for.
Every KPI needs a target attached before the period starts, full stop. Without one, a number is just trivia. Revenue last month means nothing by itself, but revenue missing its target by a wide margin starts a real conversation about what went wrong and who's on the hook for it.
Direction is where people trip up, so it pays to get right the first time. Some metrics run lower is better, like cycle time, rework rate, and change-order rate. A waste number that comes in under 100% is a win, not a shortfall, and scoring it as a miss punishes a team for doing what they were asked to do.
Franchise systems settle this with three status bands: On Target at 100% or above, At Risk from 95% up to just under 100%, and Missed below 95%. No ambiguity about what color a number turns.
Cadence isn't optional, either. An operational KPI reviewed once a month is already four weeks stale by the time anyone notices a problem, so franchise systems review week over week instead. A good dashboard also mixes lagging indicators (revenue and margin, which tell you what already happened) with leading indicators (customer count trend, labor scheduled against forecast) that tell you what's about to happen while there's still time to do something about it.
The seven KPI groups that cover a remodeling operation end to end
Franchise-grade dashboards sort every metric into a named group, so one filter narrows the whole view down to a single slice of the business. Documented franchise templates break this into seven groups.
Financial covers contracted revenue, gross margin per project, average project value, and days sales outstanding. Sales and Design covers quote-to-contract conversion and design-to-contract close rate. Estimating covers estimate accuracy variance, while Project Control covers change-order rate and schedule variance. Delivery and Operations covers on-time completion rate, average cycle time, and related operational metrics.
Supply Chain covers cabinet order lead time and countertop template-to-install time. Quality covers rework cost as a percentage of revenue, punch-list items per project, and warranty callback rate. Customer covers satisfaction score and referral rate. Workforce covers crew utilization and recordable safety incidents.
The grouping does more than keep things tidy, though. It assigns an owner to each number and a priority level to each group, so when a metric trips, there's one specific person on the hook to explain why. Franchise-level tools typically run 14 KPIs spread across these groups, enough to see the whole business without burying anyone in noise.
What the financial and sales KPIs measure (and what contractors miss by not tracking them)
Kitchen Contract Revenue and Average Project Value are the two financial anchors on most franchise dashboards. Revenue tells you scale. Average project value tells you whether pricing and scope are holding steady or getting chipped away job by job, one change order at a time.
Gross margin per project is the number that exposes the two or three money-losing jobs a blended annual margin figure buries inside a stack of profitable ones. Days Sales Outstanding is the quiet threat, the one that raises cash-flow risk a healthy revenue number hides completely. A company can look profitable on paper and still sit sixty days from a payroll problem if the average collection period keeps creeping up.
Design-to-Contract Close Rate gets watched closer than almost anything else on the board. In a documented sample month, that rate ran at 39.18% against a target of 42.48%, a score of 92.2%, which flags Missed under the three-band system. People are walking through the design process and not signing at the rate the business needs them to.
Independents skip almost all of this, and it's the single biggest blind spot on the list. Close rate gets tracked informally if at all, with no target attached, so nobody notices when it drifts. Revenue can look fine for months even as close rate quietly slides, a drift that happens because revenue is the only number anyone's actually watching. That drift happens because revenue is the only number anyone's actually watching, which is backwards. Revenue is a lagging number that tells you what already happened. Close rate tells you what's about to happen to next quarter's revenue, and it's the one nobody bothers to write down.
Project control KPIs: where independent contractors lose margin they never knew they had
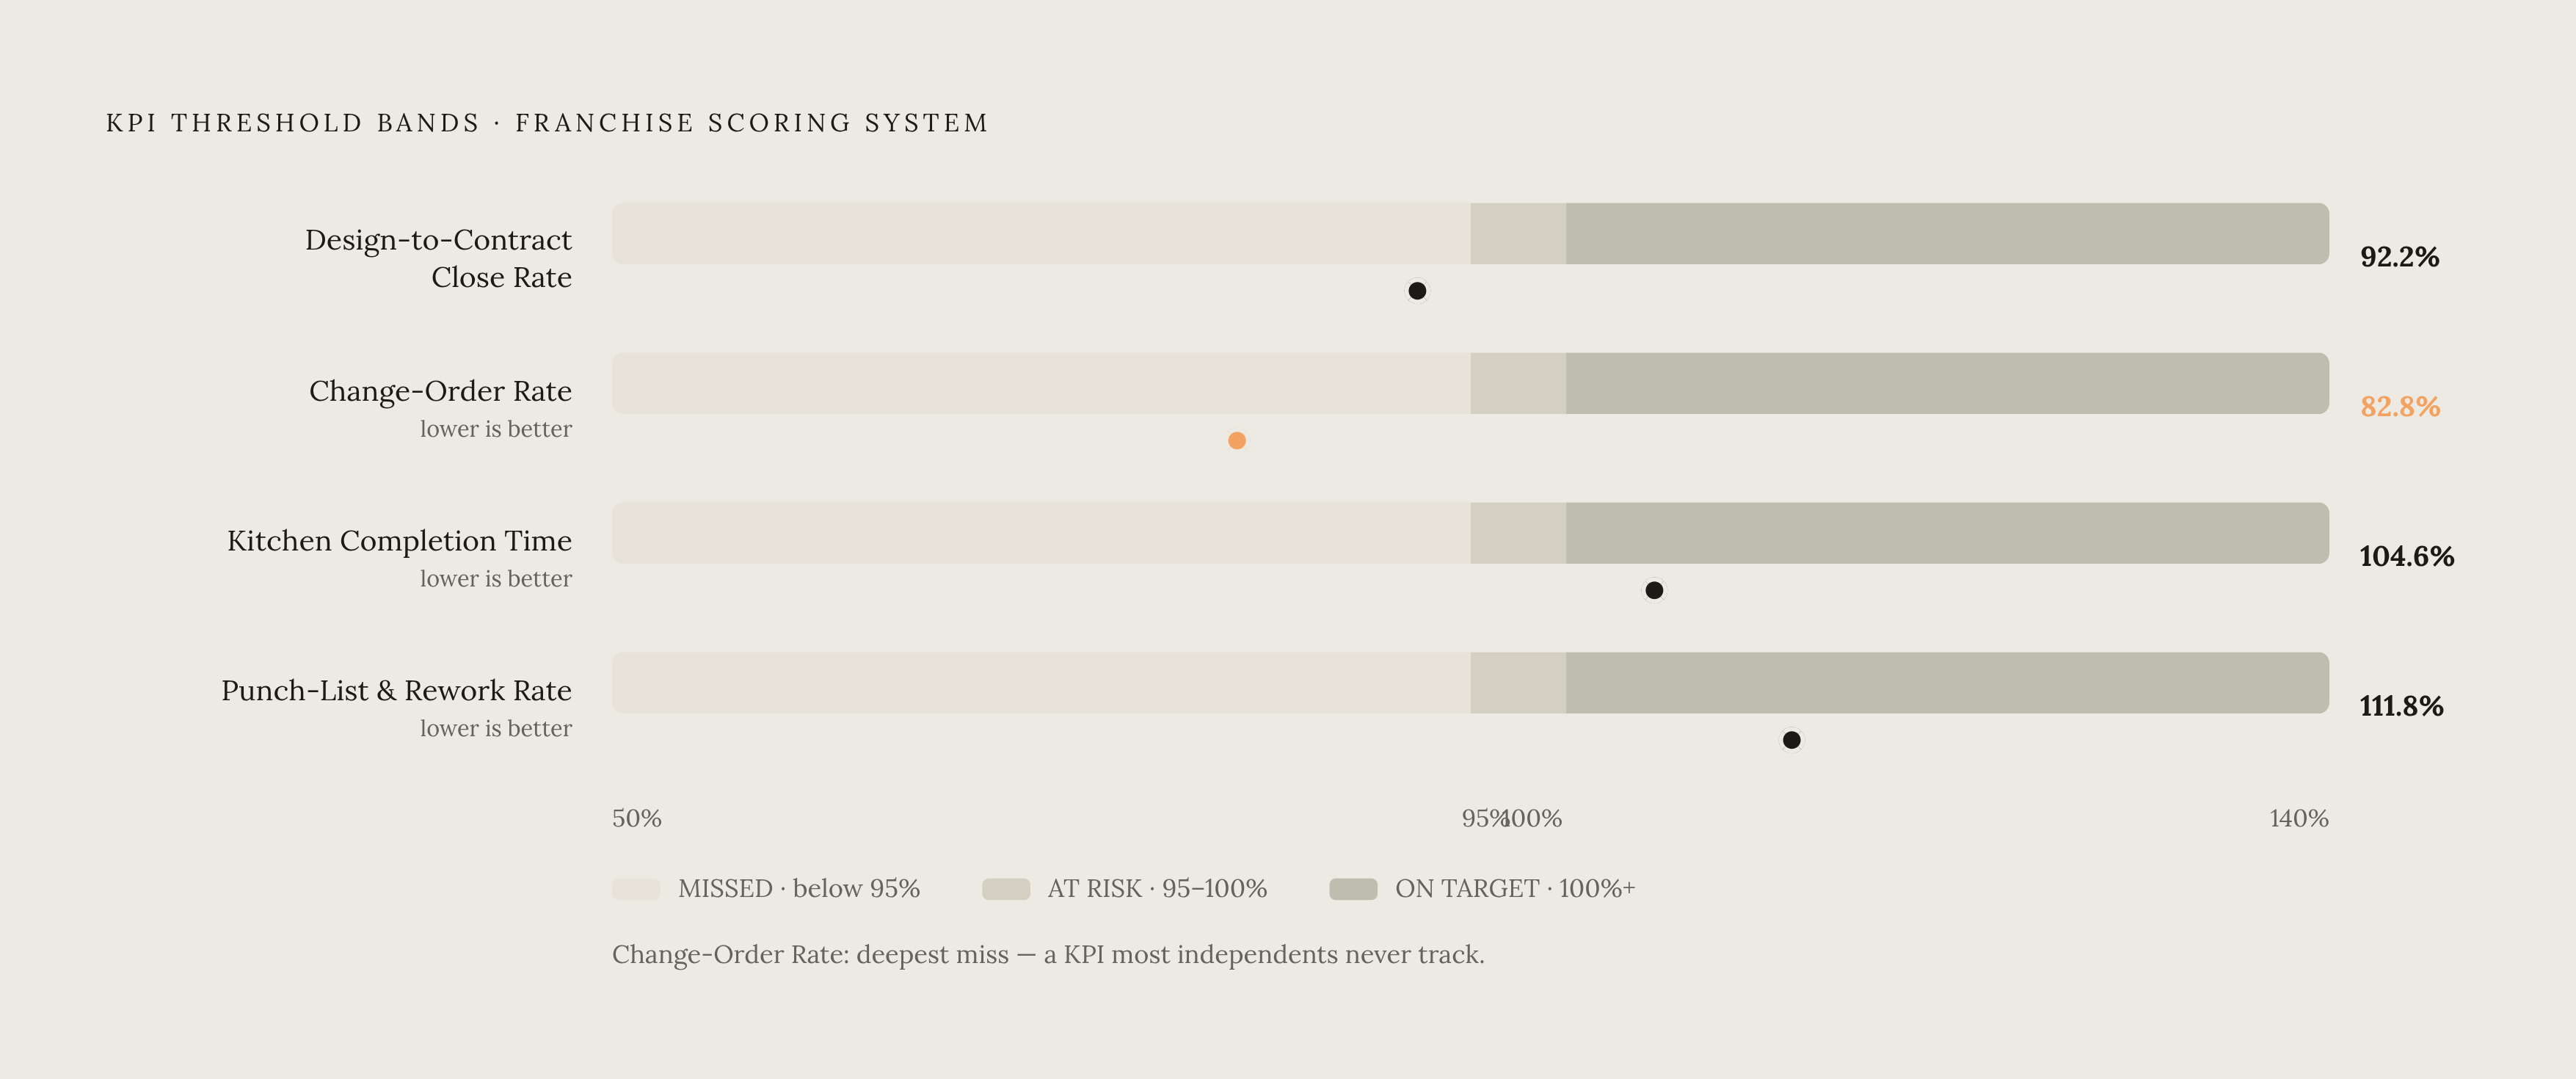
Change-Order Rate, measured as a percentage of contract value, is one of the sharpest control metrics on the board, and it's the one most independents would be embarrassed to see written down. In a documented sample month it ran at 10.15% against a target of 8.40%, a score of 82.8%, flagged Missed. A gap that size usually traces straight back to loose scope-writing, or estimating that isn't disciplined enough to hold up once the job actually starts.
Estimate Accuracy Variance tracks the gap between what a contract was signed for and what the job actually cost to deliver. It answers an uncomfortable question directly: did the estimating process hold up once the job actually started, or did hidden cost overruns quietly erode the margin?
Schedule Variance and On-Time Completion Rate look like the same thing measured twice. Schedule Variance and On-Time Completion Rate each surface different aspects of delivery performance. A job can land on the promised date and still blow the budget, or come in under budget and finish two weeks late. Tracking only one of the two hides the other failure completely, which is how contractors get blindsided by a margin problem they thought they'd already solved.
A Kitchen Completion Time example from documented franchise data shows how the lower-is-better direction plays out: an actual of 40.61 days against a target of 42.47 days scores 104.6%, a clean win, because finishing faster than planned is the whole point of the metric.
Countertop Template-to-Install time tells a rougher story in the same sample month: 11.77 days actual against a target of 10.32 days, a score of 87.7%, Missed. That's a supply-chain delay that stays invisible without this specific line on the board.
Punch-List and Rework Rate was the standout in a documented contractor dashboard sample, scoring 111.8%, the best number on the board. Recordable Safety Incidents, sitting right next to it, scored 66.7%, the worst. Strong delivery and untracked risk live in the same company at the same time more often than anyone wants to admit. That's exactly the argument for scoring each group on its own, instead of rolling everything into one "operations" number that hides both extremes behind an average.
Together, these metrics answer three questions most independents can't answer from a single source: did the job finish on time, did it finish inside contract value, and how much crew time got burned redoing work that should've been right the first time.
Supply chain and quality KPIs that franchises use to catch problems before the customer does
Cabinet Order Lead Time and Countertop Template-to-Install connect directly to schedule variance, and that connection is the whole reason to track them. A spike in lead time is a leading indicator. It flags a completion-time miss weeks before that miss ever shows up on a job report.
Appliance Damage per 100 Deliveries is a number most independents would never think to track on its own. In a documented franchise-grade sample, the actual came in at 3.54 against a target of 3.85, a score of 108.8%, On Target, though the year-over-year reading showed a slight degradation of -1.7%. Small number, but it's the kind that compounds into real cost the moment nobody's watching it.
Warranty Callback Rate per 100 projects carries the longest lag of any quality metric on the board. Workmanship problems become visible months after a job closes, right when the crew has already moved three jobs down the road and going back out is pure overhead with no new revenue attached.
Customer Satisfaction Score belongs in this group, and it isn't a feel-good vanity number. Franchises tie it directly to referral rate, the leading indicator for how much repeat and word-of-mouth business occurs next quarter.
Catching a supply-chain hiccup or a quality slip at the metric level costs a five-minute corrective conversation. Catching the same problem at the customer-complaint level costs a callback, a margin hit, and a bad review that sits online for years. That gap in cost is the entire case for tracking these numbers before a customer ever notices them.
What real franchise revenue data reveals about the range of outcomes these systems produce
Floor Coverings International's 2025 FDD Item 19 offers the only sample in the kitchen and bath remodeling category large enough to mean anything: 136 franchisees open more than 24 months as of December 31, 2024.
Median gross revenue installed came in at $895,993. Average came in higher, at $1,109,721. That gap between median and average tells its own story: a strong top tier is pulling the average well above what a typical location actually earns. Average gross margin across all 136 franchisees was 45%, with an average job size of $7,645.
The distribution is the real lesson, more than any single average. The top 14 of those 136 locations ran far above the median, and the bottom 14 ran far below it, on the same brand, the same training, the same systems. What separated them was execution discipline, not luck and not territory. That's the whole argument for the KPI framework in one data point: two operators with identical tools can be in completely different quartiles based on whether they actually run the thing.
Other brands in the category don't offer the same statistical confidence, and their headline numbers should be read with that in mind. Cabinet IQ's median comes from just two outlets, which isn't a sample; it's an anecdote with a decimal point. Kitchen Refresh's average spans close to a 64x spread across seven self-reporting locations, which makes any single "average" close to meaningless. Anyone using those two figures to benchmark a business is measuring against noise.
What the KPI framework actually guarantees is narrower than people want it to be: an operator running it knows which quartile they're in, instead of guessing from a revenue number that hides everything underneath it.
The threshold-based action protocol that turns KPI monitoring into operational decisions
A KPI that flags red on a screen and triggers nothing is decoration. The franchise model bolts a decision layer directly onto the scoring system, so a flag turns into an action instead of a color nobody responds to.
The protocol runs in three zones, tied to how far a number has drifted from target. A modest deviation from target puts a metric in the yellow zone, triggering review and a corrective action plan. A larger drift escalates to broader team involvement and resource reallocation. Past 15%, it's red: executive review and direct strategic intervention.
None of this works without standardized definitions across locations. If "on-time completion" means something slightly different at one location than another, the comparison falls apart and the whole benchmarking exercise turns into noise. Data freshness matters just as much: a protocol built on last month's numbers produces last month's decisions, applied to a problem that's already moved on. Near-real-time data is what makes a dashboard something people act on, instead of something they skim and close.
The same logic scales down for a smaller, multi-crew independent, minus the org chart. One person owns each KPI group, knows the threshold, and knows what to do the moment it trips. No escalation ladder required, just the same discipline running at the size of the business that actually exists.
How independent contractors can build and use this dashboard without a franchise's infrastructure
The tooling gap is smaller than most contractors assume. Documented contractor-grade templates already track 14 to 15 KPIs across the full KPI group structure, either in Power BI, running on 104 DAX measures with 168 monthly target rows and 336 actual rows for full prior-year comparison, or in a formula-only Excel file with no macros and no add-ins, expandable up to 22 KPI rows if the operation grows into it.
Building one from scratch mirrors the franchise approach closely. Start with 7 to 12 KPIs that match where the operation actually stands today, leading with Financial, Sales, and Project Control before layering in Supply Chain and Quality. Set a target for every KPI before the period starts, since a target set after the fact never produces a variance anyone can act on. Assign one owner and one review cadence per group, weekly for the operational numbers, monthly for the financial ones. Then write down, in advance, what happens the moment each threshold trips.
On top of the scorecard, franchise operations typically run a live dashboard layer too: real-time visibility into leads, booked jobs, ad spend, and revenue, from one login. Documented remodeling contractor dashboards break lead sources out by Google, Facebook, SEO, and direct traffic, alongside cost per lead, booked jobs, and return on ad spend, updating as events happen and viewable from a phone on the jobsite.
None of it works if the underlying data isn't captured consistently in the first place. Lead response times, quote conversion, job status updates, all of it needs to land somewhere reliable. That's usually the actual gap between an independent and a franchise: not a lack of intelligence, but manual data entry that gets skipped the moment a crew's slammed on a Tuesday afternoon. AI agents handling lead intake, quote follow-up, appointment confirmation, and job status updates can feed that data into the dashboard automatically, closing the gap without adding headcount.
Per industry research on home service contractors, the contractors closing more than half their quotes, raising prices proactively, and using AI across quoting, invoicing, and communication are the same ones most likely to report being fully booked, a pattern too consistent to be coincidence. That's not a coincidence. Clean KPI numbers and revenue growth come from the same set of habits, just measured two different ways.
A capable independent contractor can realistically chase the benchmark Floor Coverings International's system posts: 45% average gross margin and a $7,645 average job size across 136 locations. Getting there depends on one thing more than any other: whether that contractor can look at a single screen and know, right now, whether their own margin and average ticket are trending toward those numbers or sliding away from them.